How to Upload and View Your Data
ZeitMind makes it easy to upload CSV files and explore your data. This guide walks you through uploading files, opening projects, and viewing your tables.
Uploading a New CSV File
After logging in, you'll see the home page with an upload area at the top.
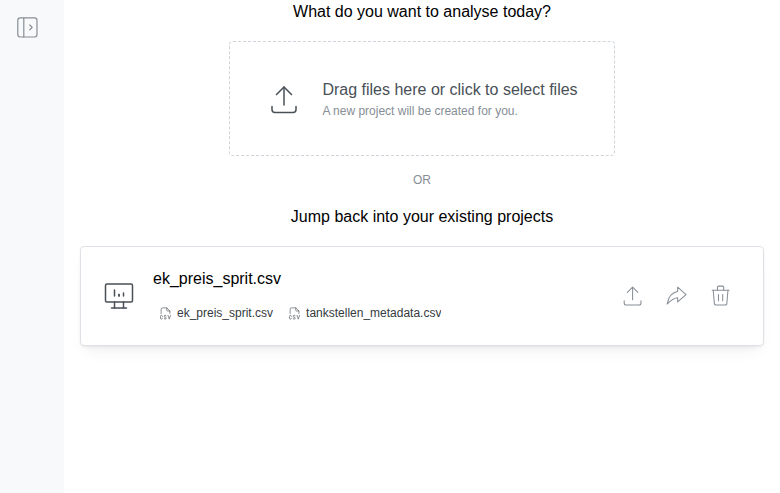
Two Ways to Upload:
- Drag and drop - Drag your CSV file directly onto the upload area
- Click to browse - Click anywhere in the dashed box to open a file picker
When you upload a file, a new project is automatically created with your filename as the project name.
💡 Tip: You can upload multiple CSV files to the same project! Just open the project and use the "Add more files" option in the sidebar menu.
Opening an Existing Project
Scroll down past the upload area to see your existing projects.
Click on any project card to open it.
Navigating to Data Prep Mode
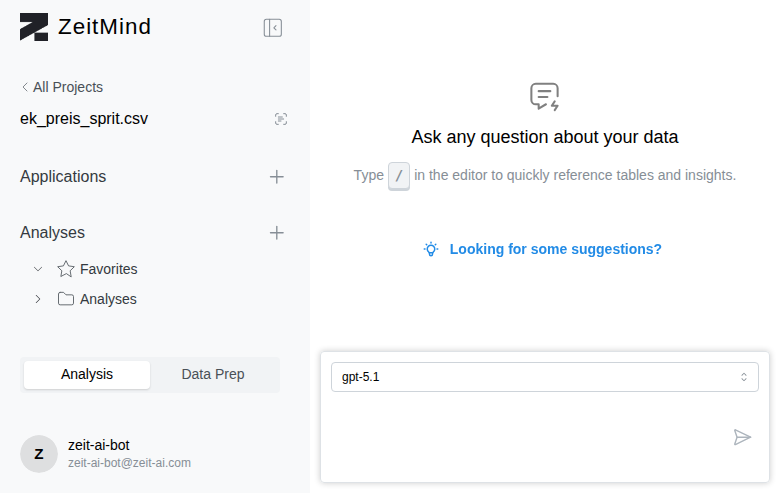
When you open a project, you'll see two tabs at the bottom of the sidebar:
- Analysis - Ask questions about your data using AI
- Data Prep - View and explore your raw data tables
Click on Data Prep to switch to the data viewing mode.
Viewing Your Tables
In Data Prep mode, you'll see your uploaded files listed in the left sidebar under "Files and Tables."
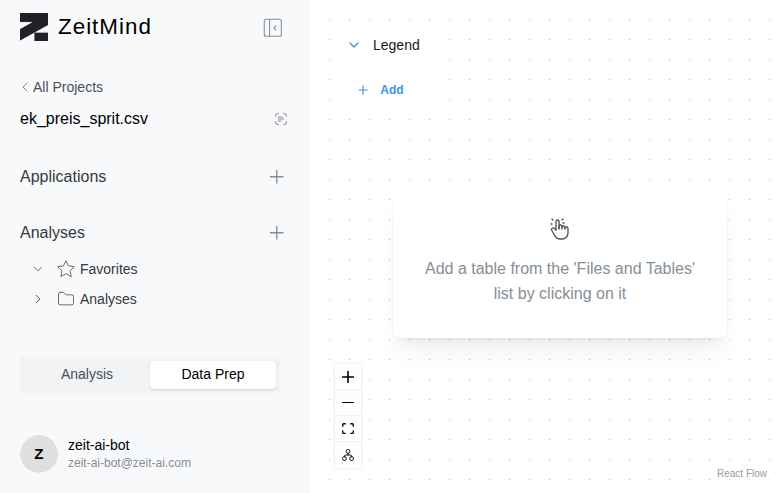
Opening a Table
Click on a file name in the sidebar to expand it, then click on the table underneath to add it to the canvas.
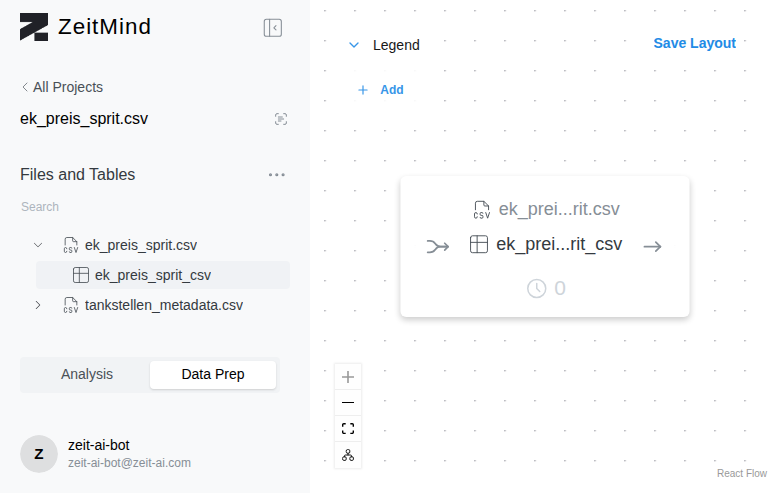
The table appears as a node showing:
- The source file name
- The table name
- Number of processing steps (if any)
Inspecting the Data
Double-click on the table node to open the data viewer.
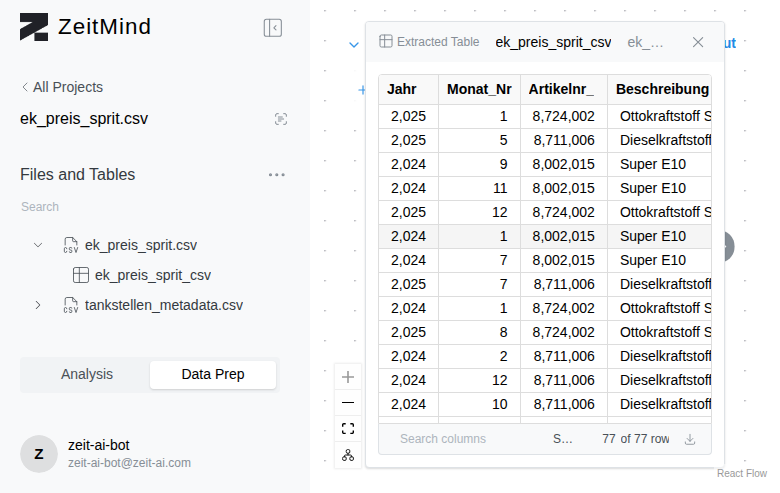
The data viewer shows:
- All columns and rows from your CSV
- Column headers at the top
- Row count at the bottom (e.g., "77 of 77 rows")
- Search box for filtering
- Download button to export the data
Sorting Your Data
Click on any column header to sort by that column.
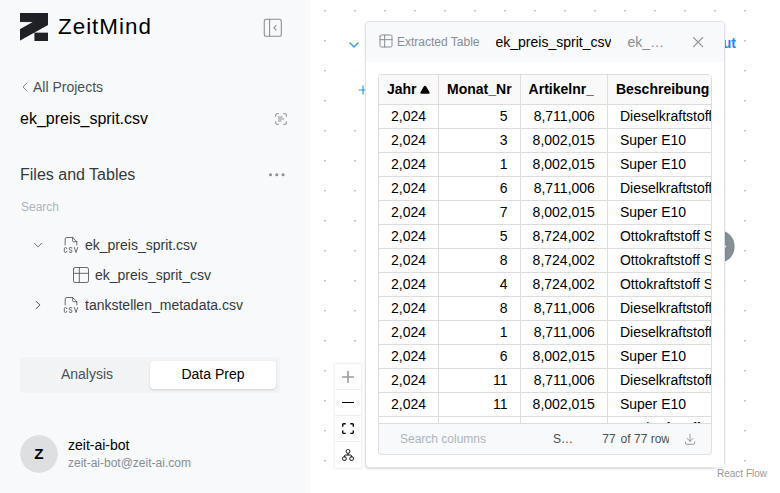
An arrow icon (▲ or ▼) appears in the header showing:
- ▲ = Ascending order (A-Z, 0-9, oldest to newest)
- ▼ = Descending order (Z-A, 9-0, newest to oldest)
Click the header again to toggle between ascending and descending order.
Searching and Filtering
Use the Search columns box at the bottom of the viewer to filter rows.
Type any text to show only rows that contain that text in any column.
💡 Tip: The search is case-insensitive and searches across all columns at once.
Downloading Data
Click the download icon (↓) at the bottom right of the viewer to export the currently visible data (including any filters you've applied) as a CSV file.
Next Steps
Now that you've uploaded and viewed your data, you can:
- Switch back to Analysis mode to ask questions about your data
- Add more files to your project using the "Add more files" sidebar menu option
- Create data transformations in Data Prep mode (advanced feature)
🎉 You're ready to explore your data! Upload your CSV files and start discovering insights with ZeitMind.