How to Build an App for Daily Workflows
ZeitMind's application builder lets you create interactive dashboards and tools from your data - no coding required. This guide shows you how to build your first app.
What Can You Build?
Applications let you create custom interfaces for:
- Daily reporting dashboards - Track KPIs and metrics
- Data exploration tools - Let non-technical users browse data
- Operational workflows - Task tracking, approvals, data entry
- Interactive visualizations - Charts and graphs that update in real-time
Creating Your First App
Step 1: Create a New Application
After opening a project (with data uploaded), look for the Applications section in the sidebar.
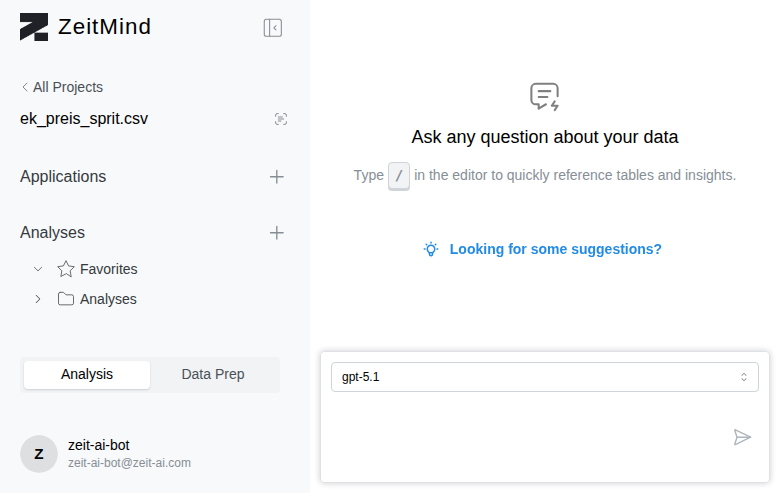
Click the "+ New" button next to "Applications".
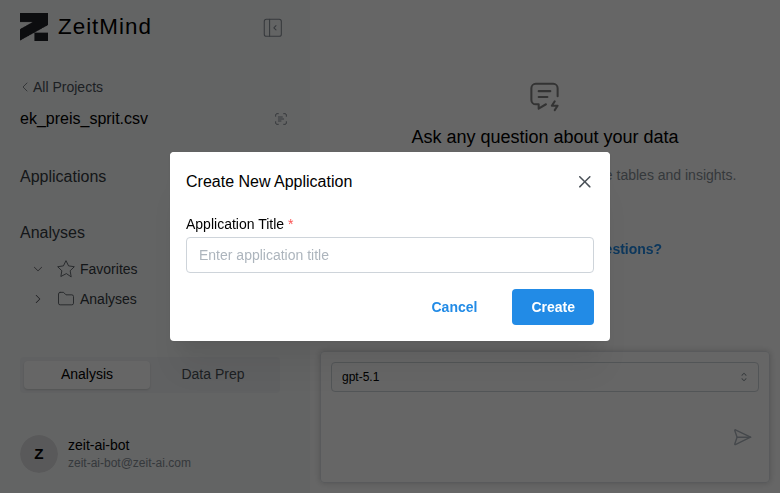
Enter a meaningful name for your app (e.g., "Fuel Price Dashboard", "Sales Tracker") and click "Create".
Your application is created and opens in view mode.
Step 2: Turn On Edit Mode
To add components and customize your app, you need to enable edit mode.
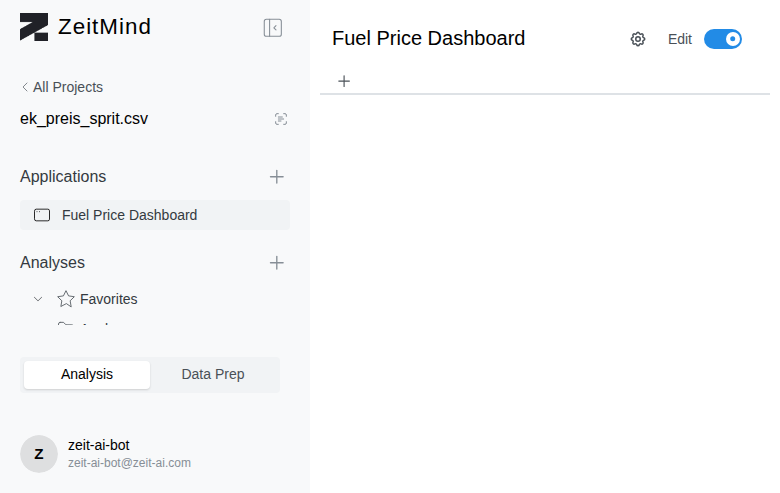
Find the "Edit" toggle in the top right and click it to turn it ON (it will turn blue).
Edit mode reveals:
- "+ Add Input" button for filters and controls
- "+ Add Panel" button for tables, charts, and metrics
- "+" button to add tabs
- Optimize Performance options
- AI-powered component generation
Step 3: Add a Tab
Apps are organized into tabs (like "Overview", "Details", "Reports").
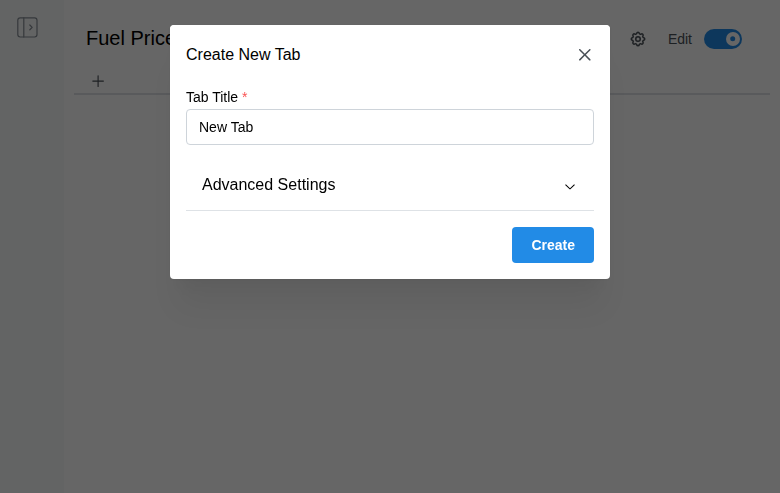
Click the "+" button in the tab bar, enter a Tab Title (e.g., "Overview"), and click "Create".
Step 4: Add Components
Your tab is now active and shows two ways to add components:
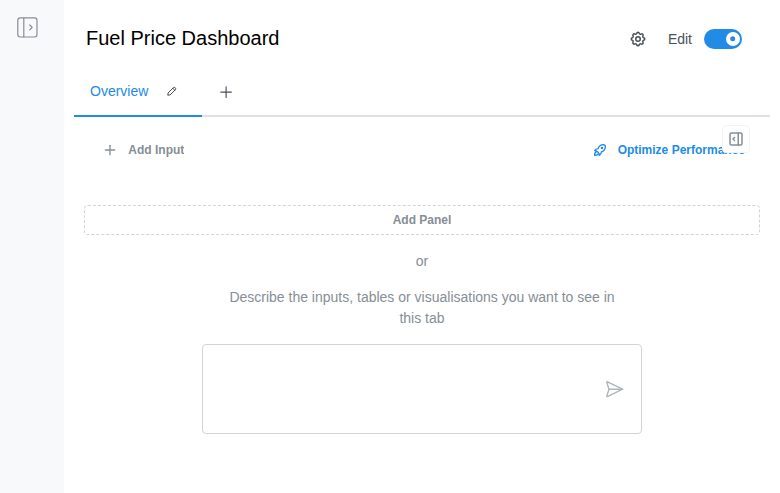
Option A: Manual Component Creation
Click "+ Add Panel" to open the component creator.
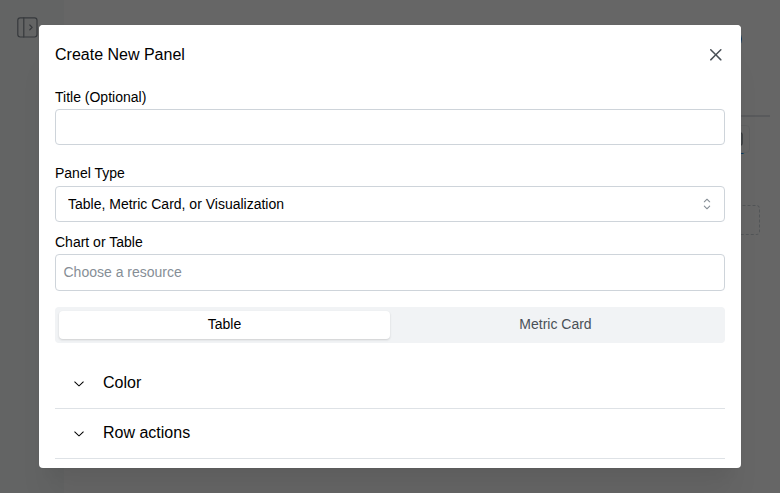
Choose your component type:
- Table - Display data in rows and columns
- Metric Card - Show a single number (KPI, total, average)
- Visualization - Charts, graphs, and other visual representations
Connect to your data:
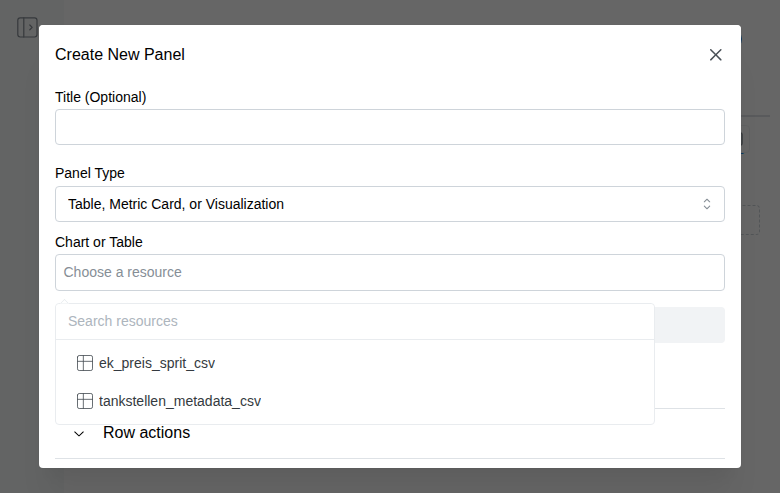
- Click "Choose a resource" dropdown
- Select a table from your project
- Click "Create Panel"
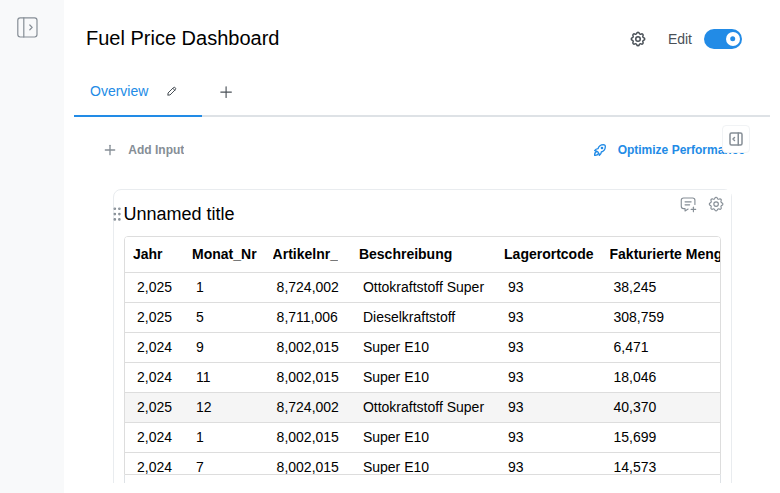
The component appears on your app with live data! It includes:
- Sortable columns - Click headers to sort
- Search - Filter rows by text
- Download - Export data as CSV
- Row actions - Right-click for context actions
Option B: AI-Powered Component Generation 🤖
Instead of manually creating components, describe what you want in plain English!
Example prompts:
- "Show me a table of all diesel prices with search and sorting"
- "Create a line chart of monthly revenue trends"
- "Add a metric card showing total sales for this year"
- "I need a bar chart comparing products by revenue"
Type your description in the text box and click send. The AI:
- ✅ Creates the component automatically
- ✅ Connects to the right data source
- ✅ Configures chart types, colors, and layout
- ✅ Saves you time on complex visualizations
Preview Your App
When you're done building, turn Edit mode OFF by clicking the toggle.
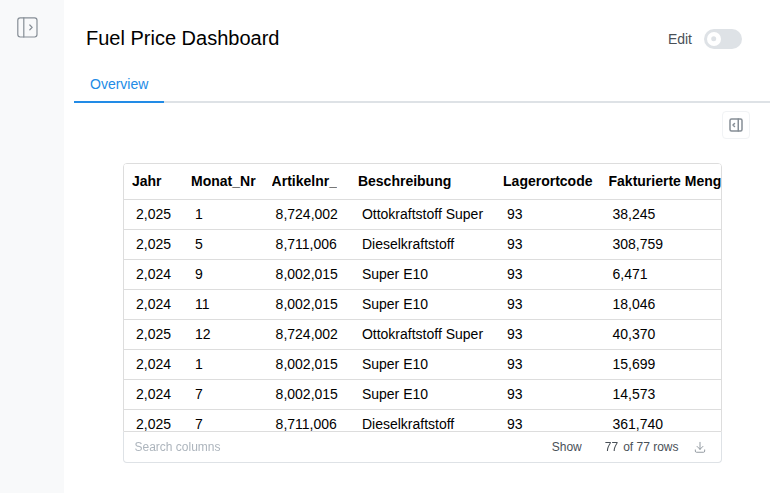
The app switches to view mode - what end users will see. All editing controls disappear, leaving a clean, professional interface.
What end users can do:
- Switch between tabs
- Search and filter data
- Sort columns
- Download data
- Interact with charts
Pro Tips
Add Multiple Tabs
Organize your app into logical sections:
- Overview - High-level metrics and charts
- Details - Full data tables
- Reports - Exported summaries
Use Inputs for Interactivity
Click "+ Add Input" to add dropdowns, date pickers, text boxes, and buttons. Inputs can control what data appears in your panels!
Name Your Panels
Give components descriptive titles:
- ❌ "Unnamed title"
- ✅ "Diesel Prices - Last 30 Days"
- ✅ "Top 10 Products by Revenue"
Good names help users understand what they're looking at.
Optimize Performance
If your app feels slow with large datasets, click "Optimize Performance". ZeitMind will suggest improvements like pre-aggregating data, adding indexes, or caching results.
Troubleshooting
"I don't see my tables in the resource dropdown"
→ Make sure you've uploaded data to the project first (see "How to Upload and View Your Data" guide)
"The AI didn't understand my description"
→ Try being more specific: mention the table name, chart type, or specific columns
"My component shows no data"
→ Check that the selected resource has rows. View it in Data Prep mode to verify.
Next Steps
Now that you know how to build apps:
- Add inputs for interactive filters
- Create dashboards with multiple charts and metrics
- Build task trackers with data entry forms
- Explore advanced visualizations - heatmaps, scatter plots, etc.
🎉 You've turned raw data into an interactive app - no coding required!